RASC Calgary Centre - Standard Magnitudes
Standard Magnitudes
by Jason Nishyama
Page last updated November 5, 2018
In this article I'll be looking at converting an instrumental magnitude, that is one that is
reported by your telescope/sensor combination to a standard magnitude, or one that is common
across instrumentation. Being able to convert from an instrumental magnitude to a standard
magnitude is of vital importance in doing photometry if you wish to report your results to outside
agencies such as the AAVSO.
Now the equipment is the same as used in the article on making your own colour-magnitude diagram.
The only addition is the need for some standard stars. A standard star is a star that has known
standard blue (B) and visual (V) magnitudes (and any other band you are interested in measuring),
and is not
variable. Ideally it is close to the object you are measuring (in the same field is best) though
if your photometry software is capable of correcting for atmospheric extinction then this is less
critical. There are catalogues of standard stars available with the catalogues of Arlo Landolt
being popular due to the stars listed being located near the celestial equator (declination 0
degrees) and thus visible from most observatories (look up Landolt stars or Landolt fields in your
favourite search engine if you're interested).
For this article I will continue to use the data from M29 that was gathered for the
colour-magnitude diagram. From that dataset I've selected five
non-variable stars of various magnitudes from the cluster to use as our standard stars. Ideally we
would use stars that were close by but not part of the cluster, but the five I've chosen will show
the technique just as well.
I looked each of the five stars up on the SIMBAD database (
http://simbad.u-strasbg.fr/simbad/
) and
obtained their B and V magnitudes. From this I was able to compute their standard B-V colour
indexes. This standard indexes are then plotted against the instrumental colour indexes (in my
case the B-G index) and a linear regression line for the plot computed as shown in Figure 1:
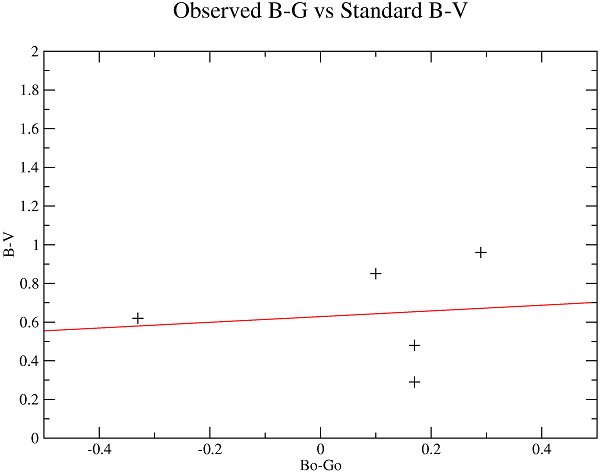
Now the linear regression line can be expressed in the general line formula:
y = m x + b
You can use a spreadsheet program or graphing software to compute the linear regression line which
will give you the values of m and b. This can then be used for the conversion between the observed
instrumental colour index (in this case B-G) to the standard colour index B-V:
B-V = b + m(B-G)
From the M29 data
b=0.623 and m=0.147 thus:
B-V=0.623 + 0.147(B-G).
So if we take a star from our dataset with an instrumental B 8.920 of and G of 8.818. This gives a
B-G of 0.102. Putting this through our conversion formula above gives us a standard B-V of
0.637.
To work out the standard V for this star we need to make another graph, this one plotting the
standard B-V versus the Standard V minus the instrumental V (in our case V-G). For our M29 example
this provides the graph in Figure 2:
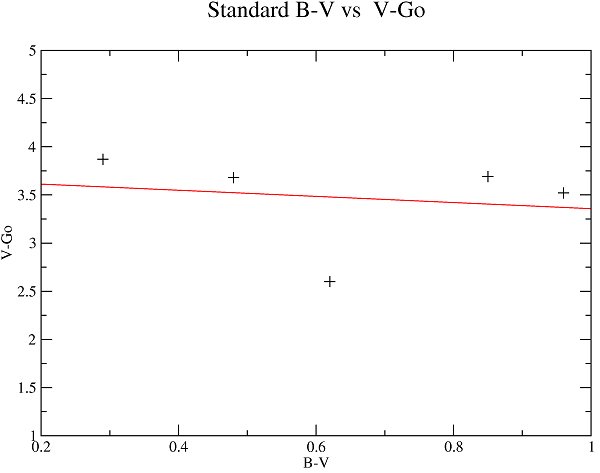
Again the linear regression line is computed and plotted. For finding V the formula is:
V = Vo + b + m(B-V)
In this case Vo (observed V) is our G and B-V is the standard B-V for the object. From the
regression line b=3.676 and m=-0.319 giving a conversion formula of:
V = G + 3.767 - 0.319(0.637)
So for our test star where G=8.818 the formula produces a standard V of 12.38. Standard B can be
computed from V and B-V with B=(B-V)+V or B = 12.38 + 0.637 = 13.02.
How does this compare to the accepted values for this star in SIMBAD? Well SIMBAD reports B=13.30
and V=12.54, both fairly close (within ~2%) to our values. In this case the difference is
partially due to the fact that the photographic B and G filters used are only moderately similar
to the standard Johnson B and V filters that form the standard.
So now you have the tools to go out and do some photometry armed with a couple of filters, a
telescope and a CCD!
|

