Page last January 29, 2026
Previous October 11, 2025 (Page originally created May 3, 2012)
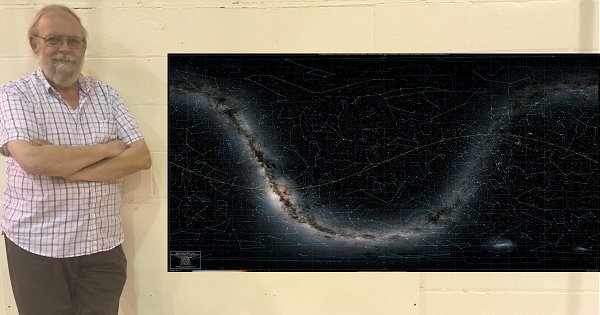
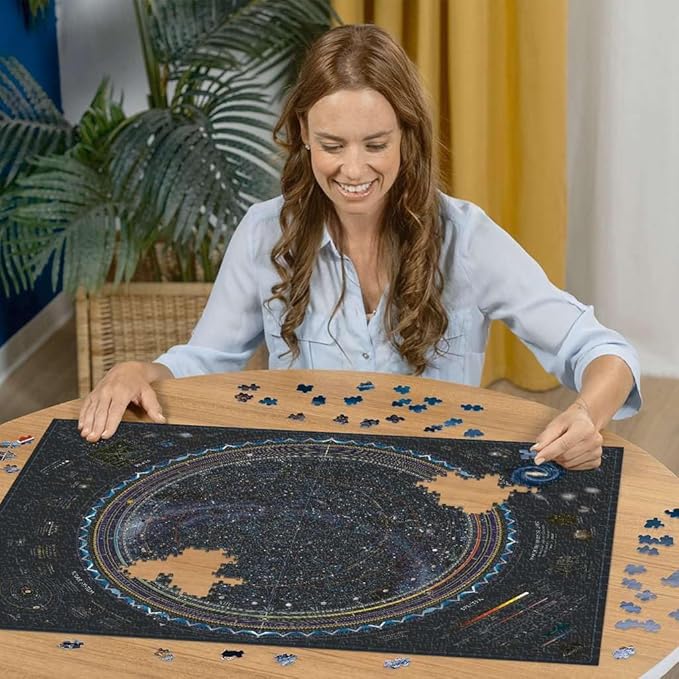
The photo below shows just how big my Mega Star Charts are.
I am pleased to report that one of my star chart maps was selected by John Hessler - a Specialist in Modern Cartography
and Geographic Information Science, Geography and Map Division at The Library of Congress, Washington, DC, for his book
"Map: Exploring the World", published by Phaidon.
The image below is a detailed view of Orion from the black and white "Standard Mega Star Chart"
On the final print, this area represents about 4x4 inches (about 10x10 cm).
The image below is a detailed view of a portion of Orion from the full colour chart.
Actual Mega Star Charts have black backgrounds - the style images shown below are reversed only for clarity.
All Mega Star Charts #1-#7 are designed to be printed 3 feet high and 6 feet wide (91.44cm x 182.88cm).
Mega Star Charts #8 is designed to be printed 3 feet high and 3 feet wide (91.44cm x 91.44cm).
Printing them smaller will result in a star chart that is unreadable.
I do not provide printed Mega Star Charts. You will need to have a printing centre print the file for you.
At this time, the charts contain only rough outlines of larger deep sky (NGC) objects at their locations.
Smaller, more detailed constellation charts should be used to determine the actual size, shape and orientation of deep sky objects.
The image files I generate are 40 to 50 MEGAPIXELS in size and
the PNG file sizes are approximately 10 to 14 MegaBytes each.
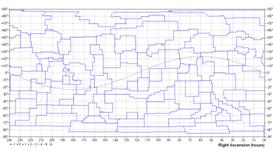
#1 - Rectangular Declination vs. Right Ascension
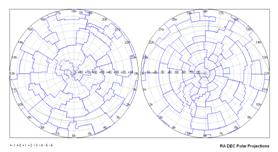
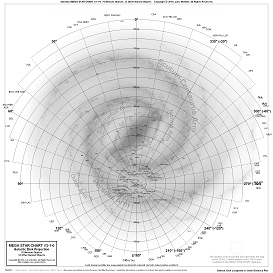
#2 - Polar (N and S) Right Ascension and Declination
#3 - Winkel Tripel Declination vs. Right Ascension
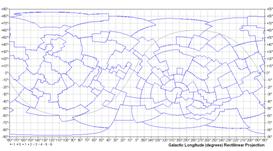
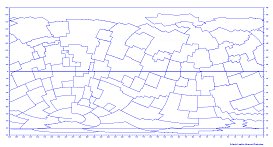
#4 - Rectangular Galactic Latitude vs. Galactic Longitude
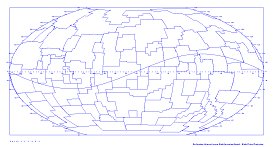
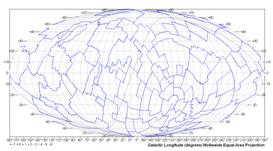
#5 - Galactic Latitude vs. Longitude - Mollweide projection
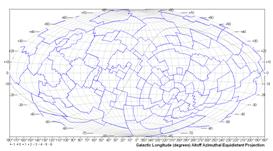
#6 - Galactic Latitude vs. Longitude - Aitoff projection
#7 - Rectangular Ecliptic Latitude vs. Ecliptic Longitude
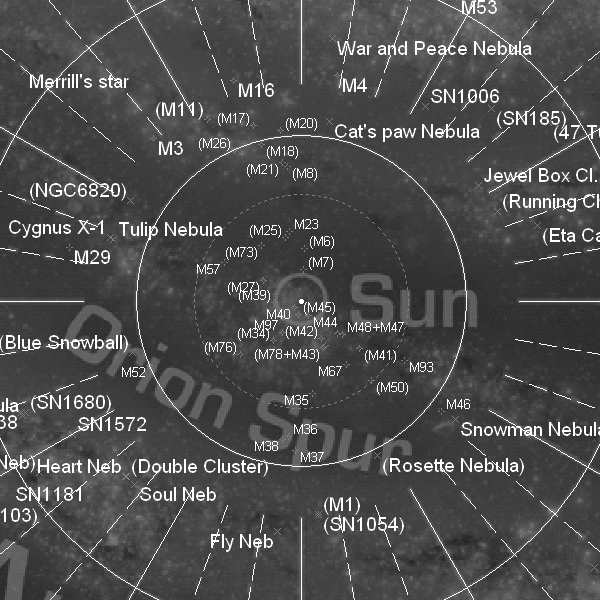
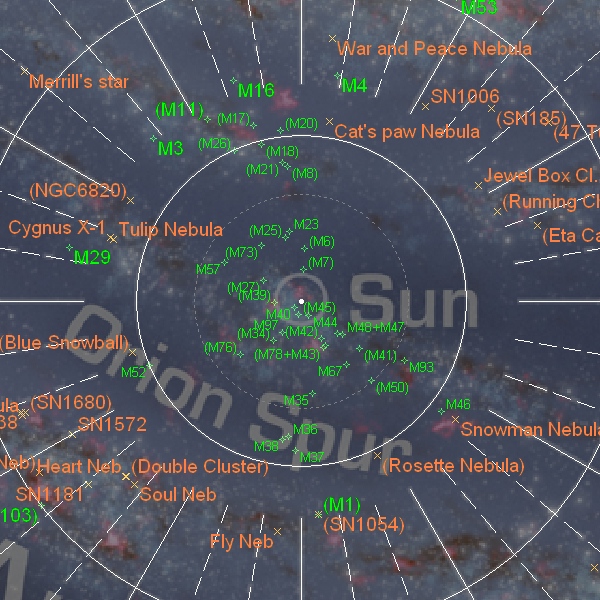
#8 - Galactic Disk Longitude vs. Solar Distance
The area around the Sun in the #8 - Galactic Disk Longitude vs. Solar Distance chart shown above. Click for a larger image.
Contact me regarding a Copyright Release to use any of these maps in books or any other internet, broadcast or published works.
Note: Always visit this page to get the link to the current file versions.
Duplicates of my Copyright work that have been taken and posted
on the internet elsewhere are old outdated versions.
If you want the "standard" #1 - Rectangular Declination vs. Right Ascension Mega Star Chart
with all the standard options shown below, then right clickTHIS LINK,
save the file to your PC,
and take it somewhere to get it printed.
If you want the "standard" #2 - Polar (N and S) Right Ascension and Declination Mega Star Chart
with all the standard options shown below, then right clickTHIS LINK,
save the file to your PC,
and take it somewhere to get it printed.
If you want the "standard" #8 - Galactic Disk Longitude vs. Solar Distance Chart
then right clickTHIS LINK,
save the file to your PC,
and take it somewhere to get it printed.
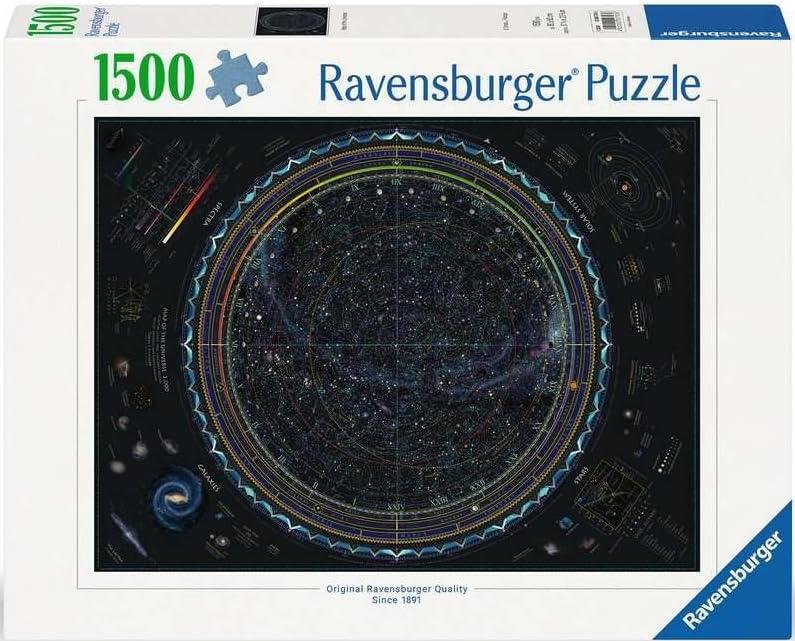
My Polar Chart has been used in a Ravensburger 1500 piece Jigsaw Puzzle you can order!
Note: The artist for this puzzle started with my free N. Hemisphere Polar Chart (Color)
and then added numerous other astronomical details surrounding the circuilar chart.
Customized Mega Star Chart Request Form
I am only accepting requests for customized Mega Star Charts from RASC Centres, and Professional Observatories at this time.
I do not have the capacity to provide personal customized Mega Star Charts.
Please fill in the following for EACH Mega Star Chart requested:
** Required field
The defaults shown define the "Standard Mega Star Chart" available above.
** RASC Centre or Professional Observatory name:
** Your Name:
** Your E-mail address:
Colour Format:
Monochromatic (gray levels)
Full Colour
Projection Requested:
#1 - Rectangular Declination vs. Right Ascension
#2 - Polar (N and S) Right Ascension and Declination
#3 - Winkel Tripel projection Declination - vs. Right Ascension
#4 - Rectangular Galactic Latitude vs. Galactic Longitude
#5 - Galactic Latitude vs. Longitude - Mollweide projection
#6 - Galactic Latitude vs. Longitude - Aitoff projection
#7 - Rectangular Ecliptic Latitude vs. Ecliptic Longitude
#8 - Galactic Disk Longitude vs. Solar Distance - NOTE: none of the options below apply to this chart.
All Mega Star Charts come with:
Labelled axes
Coordinate grid
Star magnitude legend
Title
Select the following options:
The Ecliptic line
Constellation Boundary lines
Constellation "Stick Figure" (Asterism) lines
Constellation Names
Milky Way Galaxy ESA Stellar Density background image
Show Precession of the Celestial Poles from 11000 BC to 14000 AD
119613 Stars some down to magnitude 21 OR: Limit magnitudes to:
9
10
11
12
13
14
Star Name labels for approximately 183 stars
The 110 Messier objects marked and labelled "M"
NGC OPTIONS:
Include the following NGC items:
All NGCs - markers ONLY
The 100 Finest NGCs - marked and labelled "F"
and the 109 Caldwell objects marked and labelled "C"
The Herschel 400 objects marked ONLY
The Herschel 400 objects marked and labelled with NGC numbers (will appear quite messy in places)
Other Named Objects:
The following objects (and perhaps more) marked and labelled
N Celestial Pole, S Celestial Pole
N Ecliptic Pole, S Ecliptic Pole
N Galactic Pole, S Galactic Pole
Hubble Deep Field Locations: HDF-N, HDF-S, HUDF
Large and Small Magellanic Clouds (and boundaries)
40 Eridani B - the only visible white dwarf (Sirius B is occasionally possible with an occultation mask)
Coalsack Nebula
Cor Caroli
Cygnus X-1
the Double Cluster
Gienah (in Corvus)
Hanny's Voorwerp
Kemble's Cascade
Merope
Hoag's Object
Mayall's Object
The Red Rectangle Nebula (HD44179)
The Red Square Nebula (MWC922)
A selection of the reddest stars (see: this article)
HD162826, HR6669, HIP 87382 = "Sibling" (my unofficial name) - the star (now in Hercules) most likely created in the
same stellar nursery as The Sun - announced May 8, 2014 by the team at McDonald Observatory at the University of Texas at Austin.
See: https://mcdonaldobservatory.org/news/releases/2014/05/08
e Lyr DblDbl - The Double-Double in Lyra
Rukh - delta Cygnus
Sadr - gamma Cygnus
BL Lacertae - the prototype Blazar
3C 48 and 3C 273 - the first two Quasars found
Baade's Window
California Nebula
Delta Crux
Plaskett's star
Einstein Cross
Fomalhaut, Fomalhaut B, Fomalhaut C
North American Nebula
Sgr A*
E Veil Nebula, W Veil Nebula
Witch Head Nebula
Sky positions for the East and West detections of the WOW! Signal
TRAPPIST-1 - the star with 7 exoplanets 39.5 ly from Earth
SM0313 - the oldest known star with an accurate determination of its age of 13.6 billion years just 6000 ly from Earth
Uranus discovered here 13 March 1781
Neptune discovered here 24 Sept 1846
Pluto discovered here 24 Jan 1930
Pluto's apparent celestial path 2015 to 2026
Releases:
V1.3 May 21, 2012: Lighter Milky Way shading to print more visibly. Additional named objects.
V1.31 August 28, 2012: Additional named objects.
V1.4 June 9, 2013: Additional named objects.
V1.5 April, 2014: Code optimization and extended Polar range.
V1.6 May 12, 2014: Additional named objects.
V2.0 January 10, 2016: Colour versions.
V2.1 February 21, 2016: HYG Database updated to V3 as at December 17, 2015. New Black and White and Colour versions.
In the new colour chart versions, the Messier, Finest NGC, Caldwell, and "Other" objects and their names are different colours, and a "Marker" colour legend was added to the bottom of the charts.
V2.2 March 16, 2016: Winkel Tripel projection added. More informative Ecliptic Line. Additional named objects.
V2.3 March 23, 2016: Larger constellation names font. Brighter milky way fill. Added 180 "nebulas" (rough outlines only).
Added tiny lines from stars to their names. Added boxed description of the chart at the lower left.
V2.3.3 March 29, 2016: The RA-DEC charts #1 and #3 now include the precession of the Vernal Equinox along the Ecliptic over thousands of years.
Additional named objects. Now 181 "nebulas".
V2.4.1 March 29, 2016: Ecliptic projection added. NGC catalog updated.
V2.4.2 April 27, 2016: Right Ascension axis tic marks now in 1/10 hours instead of 1/4 hours.
Added 1173 Bayer (Greek letter) designations for stars with no names.
V2.4.3 November 28, 2016: See the FAQs section below regarding the new IAU catalog of star names.
V2.5.1 November 1, 2017: New Background Milky Way image adapted from ESA/Gaia Stellar Density Map 2015 by Edmund Serpell - CC BY-SA 3.0 IGO
(instead of the rough coloured border).
V3.1.0 April 17, 2018: Introduction of the #8 - Galactic Disk Longitude vs. Solar Distance chart.
V3.2.0 April 28, 2018: Introduction of the new background Milky Way image adapted from ESA/Gaia/DPAC DR2 "Gaia's sky in colour - Equirectangular Projection" 25 April 2018.
Other objects of interest may or could be added to an image on request
if the coordinates are available or supplied in RA-DEC or Galactic l,b forms.
Comments or Suggestions:
Privacy Statement: The information you submit is used only for generating your Mega Star Chart and e-mailing it to you.
The Calgary Centre of the RASC never divulges information to any third party.
If you want to keep a copy of this form - print this page (or take a screen "capture") before clicking Submit below.
Click the Submit button to send this form via e-mail. If the e-mail submission process does not work on your computer, then please
send an e-mail with ALL the required information (or send screen captures) to:
COLOUR VERSIONS
In January 2016, I completed work producing COLOUR Mega Star Chart File versions (a.k.a. COLOR Mega Star Chart Files).
PLEASE NOTE:
Printing an 18 square foot (1.7 square m) image in colour can be very expensive.
Printing them smaller will result in a star chart that is unreadable.
I do not guarantee that the colours will print correctly on all large format printers/plotters.
The colours used are not customizable. (See: FAQ #15 at the end of this page.)
The links to the standard charts #1 and #2 above are still for the black-and-white versions.
These are NOT "Constellation Maps". These are whole sky maps and therefore suffer from distortions
the further one gets from the centre of the map. You will NOT be able to "crop" out sections and print them without encountering things like Ursa Minor being 6 ft wide.
Besides, cropped sections would NOT have the RA and DEC values printed for the lines, and would be missing the stellar
magnitude legend, and the colour index legend.
However, if anyone is interested in downloading a COLOUR Mega Start File and trying to get it printed,
then please contact me via e-mail and I will send you the file - providing you let me know if it was successful,
where it was done, the type of printer/plotter used, and any special printing instructions that might be necessary
so that I can report them here.
V2.2 March 16, 2016
This version incorporated the following changes:
The Winkel Tripel projection was added (See FAQ #16 below).
In all charts, the Ecliptic line is calculated and now a small filled circle is placed on the line showing the position
of the Sun on the first of every month for the 100 years 2000 through 2100.
Due to precession, we have to introduce leap years into our calendar approximately every 4 years to keep the Sun in the same
(approximate) location for the "March Equinox". The effects of precession and leap year days create a bounded area where
we see the Sun on the first of every Month - appearing as "smudge" areas on the Ecliptic line. Without these calendar
corrections the Sun would continue to drift across the sky until we were celebrating summer in December.
Also, a darker line has been added which is a simple curve where declination = -sin(right ascension) times
the Obliquity of the Earth's tilt(which changes over the years).
Although this approximates the Ecliptic, you can see the effects of the Earth's tilt, it's elliptical orbit, aphelion distances
and perihelion distances causing
the Ecliptic to deviate from a perfect Sin curve. The difference is small, but my Mega Star Chart maps are big enough
to be able to see the difference.
The names for the other two members of the very widely separated Fomalhaut triple star system have been added. One of these
(Fomalhaut C) is actually in a different constellation than Fomalhaut and Fomalhaut B. The components of this triple system
are separated by distances many times the diameter of the Moon. You would need a 100mm lens, not a telescope, to capture an image
of all three stars.
V2.3 March 23, 2016
This version incorporated the following changes:
A larger and slightly brighter font to make the constellation names names stand out.
A brighter milky way background fill to make it more visible on both monochrome and colour charts.
180 "nebulas" were added (rough circular or elliptical outlines only). These are all the NGC objects that have a
non-stellar shape and whose dimensions are large enough to be visible on the charts. No names are provided
since many already have other designations, or the chart would simply be too cluttered. Refer to smaller,
more detailed constellation maps to identify any that are not labelled.
Tiny lines were added from stars to their names. Due to "crowding" or star names overlaying other important
objects, each star name on the standard chart is examined and moved if necessary to avoid the problem.
This meant that some star names were to the right, some to the left, some higher and some lower.
Since all other objects have a "marker" showing the actual location, I added small horizontal lines to the beginning
or ending of the star names to serve as pointers to which star is the one meant.
All charts now include a boxed description of the chart and a summary of its objects at the lower left.
Versions V2-3 of the Standard #1 and #3 charts now include dated marks showing the precession of the
Vernal Equinox along the Ecliptic over thousands of years.
V2.4.2 April 27, 2016
This version incorporated the following changes:
Chart type #7 - Rectangular Ecliptic Latitude vs. Ecliptic Longitude projection added.
Updated the NGC catalog - now with 8411 items vs 8290
Right Ascension axis tic marks now in 1/10 hours instead of 1/4 hours
Added 1173 Bayer (Greek letter) designations for stars with no names
V2.4.3 November 28, 2016
This version incorporated the following changes:
Updated star names from the November 2016, IAU list.
V2.5.1 November 1, 2017
This version incorporated the following changes:
New Background Milky Way image adapted from ESA/Gaia Stellar Density Map 2015 by Edmund Serpell - CC BY-SA 3.0 IGO
(instead of the rough coloured border)
V3.1.0 April 18, 2018
This version incorporated the following changes:
Introduction of the #8 - Galactic Disk Longitude vs. Solar Distance chart.
V3.2.0 April 18, 2018
The latest versions of the Mega Star Chart files are "V3-2-0".
This version incorporated the following changes:
Introduction of the new background Milky Way image adapted from ESA/Gaia/DPAC DR2 "Gaia's sky in colour - Equirectangular Projection" 25 April 2018.
FAQS, Credits and Acknowledgements:
How are the Mega Star Chart Files generated? - The files are generated by a customized program I wrote
for my PC which reads the databases, draws the 40-50 megapixel images based on the options chosen,
and saves the file as a PNG image.
What stellar database was used for each star location, brightness, and name? - I started with the
"https://astronexus.com/projects/hyg" by David Nash,
- a combination of the the Hipparcos Catalog, the Yale Bright Star Catalog (5th Edition), and the Gliese Catalog of Nearby Stars (3rd Edition)
hence the name "HYG". I then referenced a number of other lists concerning stars with "proper names" and added star
names to the HYG data if it had none. Examples were:
The Navigation stars by Her Majesty's
Nautical Almanac Office and the US Naval Observatory, in the production of the yearly Nautical Almanac which the two
organizations have published jointly since 1958.
On November 18, 2016, the IAU (International Astronomical Union) Working Group on Star Names (WGSN) released
their catalog of 227 star names after considerable research into many sources of historical naming of stars.
This "official" list of star names included 101 "new names" previously not in the Mega Star Chart data as well as
thirteen name changes. I have changed the thirteen names to match the new IAU catalog.
However, at this time I have not added the 101 new names because a)most are obscure, and b)positioning all the new names
on the charts so as not to obscure important details will require many hours of checking hundreds of names
in each of the 7 different charts.
This entire 119,613 record database was then sorted according to magnitude so that dimmer stars would always be on top
should two stars overlap at the resolution of the final image.
What was the source for the "Constellation Boundary Lines"? - Several years ago I wrote an article on
The Constellations including calculating their lowest, highest, and midpoint coordinates
as well as listing their areas. As I mentioned in the article, All coordinates are Epoch 2000.0 and have been re-computed
from the original source by the author since many of the constellation lists available elsewhere on the internet contained
many errors. (The constellation boundary data below was derived from
Catalog VI/49 Constellation Boundary Data
(Davenhall A.C., Leggett S.K. 1989) Centre de Données astronomiques de Strasbourg - CDS Vizier data catalog)
What was the source for the "Stick Figure (Asterism) Lines"? - I started with, but heavily modified the line definitions of
Dan Bruton, SFA Observatory, Stephen F. Austin State University, Texas DanBruton.com.
Since there is no international standard for "stick figures", and there are many different versions, I chose the final
values based on my preferences.
What was the source for the "Milky Way Galaxy Approximate Outline"?
In prior versions I started with a definition file
I found from Jarmo Moilanen, Finland and made many changes to work with my program, avoid gaps, and eliminate crossed lines to allow
shading the enclosed area.
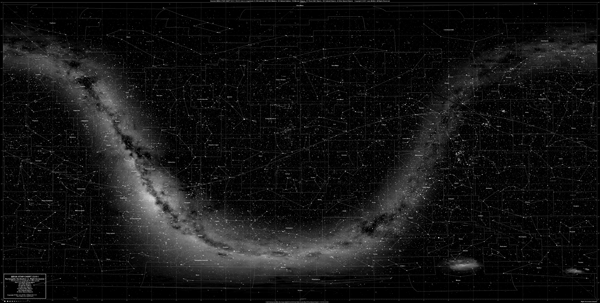
In Version 2.5.1 this was replaced with a new background Milky Way image for each projection which I adapted from
the ESA/Gaia Stellar Density Map 2015 by Edmund Serpell
under the Creative Commons Attribution-ShareAlike 3.0 IGO (CC BY-SA 3.0 IGO) licence. An example is shown below:
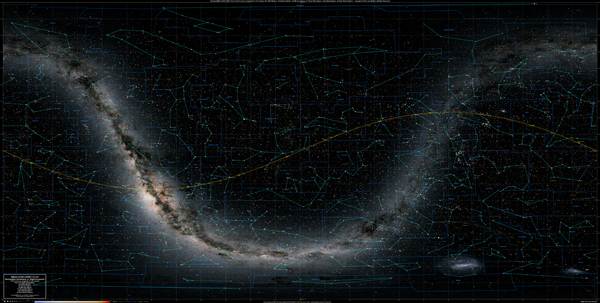
In Version 3.2.0 this was replaced with a new background Milky Way image for each projection which I adapted from
ESA/Gaia/DPAC DR2 "Gaia's sky in colour - Equirectangular Projection" 25 April 2018
under the Creative Commons Attribution-ShareAlike 3.0 IGO (CC BY-SA 3.0 IGO) licence. An example is shown below:
What was the source for the "Messier Objects"? - Over the years I've done a lot of work on
the Messier objects such as my article on them written years ago,
and my Messier Marathon Planner web app.
For this project I adopted the J2000 RA and Dec coordinates for each object from the
SIMBAD values.
What was the source for the "Finest NGC Objects"? - the original list as published in the RASC
Observer's Handbook.
What was the source for the "Caldwell Objects"? - The original source was the 1995 list published by
Sky & Telescope magazine, with the correction for NGC 6087 (originally listed as NGC 6067 in error).
For this project I adopted the J2000 RA and Dec coordinates for each NGC object from the
SIMBAD values.
What was the source for the "Herschel 400s"? - the Astronomical League list of the
The Herschel 400 Program
with corrections for a few items with incorrect Galactic (l,b) coordinates.
How were the Galactic coordinates generated? - For every object, I recomputed the galactic longitude
and latitude (l,b) using Epoch 2000 algorithms in my program.
Other objects - the coordinates of the other objects were retrieved from the original source, Wikipedia,
or retrieved from SIMBAD.
Verification - all results were compared against many existing maps such as smaller maps I
had previously created, maps easily found online such as those produced by
Jim Cornmell for the Messiers, Caldwells, and Herschel 400 used on Wikipedia,
and other maps produced by professional observatories such as the Hubble-NASA-ESO Northern and Southern Hemisphere
Star Chart.
24592 from here down, the stars are generally from the catalog of the closest stars to the Sun
mag > 10 and ≤ 11
7498
mag > 11 and ≤ 12
2360
mag > 12 and ≤ 13
831
mag > 13 and ≤ 14
425
mag > 14 and ≤ 15
247
mag > 15 and ≤ 16
115
mag > 16 and ≤ 17
42
mag > 17 and ≤ 18
23
mag > 18 and ≤ 19
7
mag > 19 and ≤ 20
4
mag > 20 and ≤ 21
2 (one star at 20.1 and 1 at mag 21)
Total =
119613
Which colours were used for the stars on the COLOUR Mega Start Files, and how were they determined?
Most of the stars in the HYG database have a "Color Index" which is the "blue magnitude - visual magnitude" value
for the star (where known), ranging from -0.4 (hot blue stars) to +5.46 (for very dim red stars). I then used the information on
this link by Mitchell Charity
at The Massachusetts Institute of Technology to develop a routine to take the B-V value and generate
an RGB colour for a colour monitor. However, his algorithm only handled B-V values from -0.4 to +2.10
so I added a single additional red colour for all stars above +2.15 e.g. those on my list of
the reddest stars. The resulting colours are shown below
and in the legend on the COLOUR charts (click for the full-sized legend):
So, the colours produced are APPROXIMATIONS to the visually filtered appearance of stars, calculated for an RGB monitor.
They are NOT the same colours as seen in long-exposure deep-sky images (like Hubble's) which use completely different
colour processing techniques, and camera images which do not suffer from limited colour vision at night like humans do.
In addition, colour monitors produce slight variations in RGB colours unless they are "calibrated" with a
colour-sensitive light meter, and printers often do not reproduce exactly the same colours as seen on a monitor.
All flat 2-dimensional maps of a 3-dimensional sphere (e.g. the Earth and the Celestial Sphere) suffer from
distortions in angles, distances, and areas (like Ursa Minor in the Standard #1 Mega Star Chart being 6 feet wide).
Many different map projections have been created by mathematicians and geographers over the last few centuries in an
attempt to minimize certain distortions for specific uses, but none can completely eliminate all distortions
for all users except a physical 3-dimensional globe.
The name Tripel (German for "triple") refers to Winkel's goal of minimizing (not eliminating) the three kinds
of distortion.
The chart does include all latitudes from -90 to +90, with greatly reduced distortion (compared to rectangular maps) near the poles
(which appear as wide horizontal lines in this projection - i.e. the maps are not "clipped" at some extreme latitude.)
As per the Wikipedia reference: "In 1998, the Winkel tripel projection replaced the Robinson projection as the
standard projection for world maps made by the National Geographic Society. Many educational institutes and textbooks
followed National Geographic's example in adopting the projection, and most of those still use it."